How to Represent a Logical Output Function?
We shall now explore the logical representation of a function through truth tables. So far, we’ve worked primarily with Boolean expressions and logic diagrams, which are the most common formats for representing output functions. However, when the number of inputs is small, a truth table offers a clear and compact way to describe the behavior of a logic circuit.
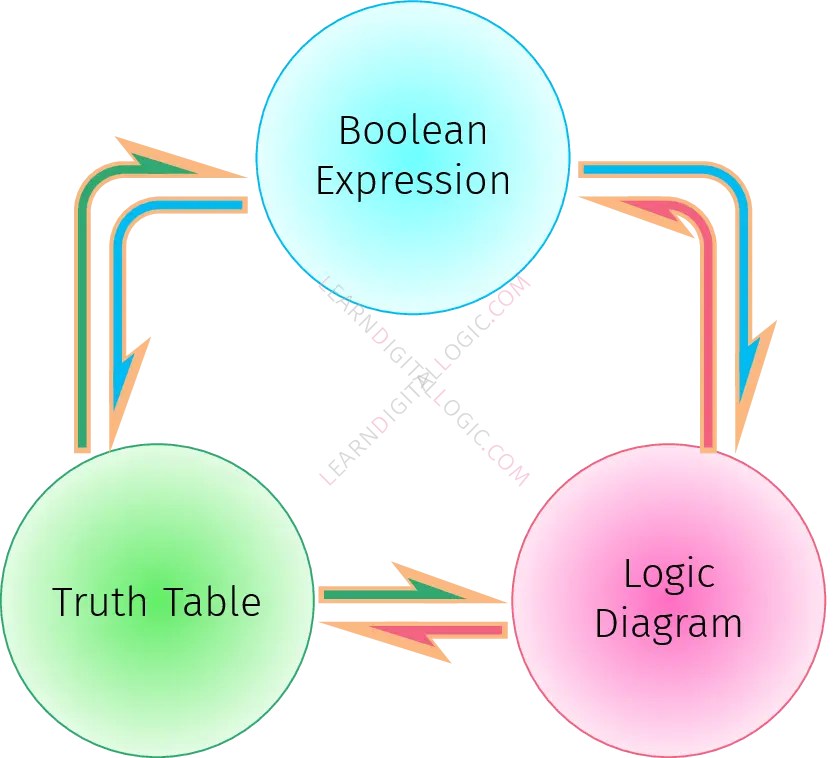
These three forms—Boolean expressions, logic diagrams, and truth tables—are interconvertible, and we’ve already discussed how to translate between logic diagrams and Boolean expressions. In this section, our focus shifts to the truth table and how to derive both a Boolean expression and a circuit diagram from it using the concepts of minterms and maxterms.
What is a Truth Table?
A truth table is a structured listing of all possible input combinations and their corresponding output(s). Inputs are typically arranged on the left, while the output signals appear on the right. For example, with two input variables, there are \(\mathsf{2^2=4}\) combinations: \(\mathsf{00,01,10}\) and \(\mathsf{11}\). Each row in the table represents one of these combinations along with the desired output value.
Number of Input Combinations in a Truth Table
The total number of input combinations is always \(\mathsf{2^n}\), where \(\mathsf{n}\) is the number of input variables. These combinations are usually ordered from the binary equivalent of \(\mathsf{}0\) up to\(\mathsf{2^{n}-1}\). In cases where certain input combinations are irrelevant or unused, we may assign their outputs as \(\mathsf{X}\)—the \(\mathsf{X}\) indicating a Don’t Care condition, meaning the output can be either \(\mathsf{0}\) or \(\mathsf{1}\) without affecting the overall function.
Now that we have a foundational understanding of truth tables, we’ll introduce minterms and maxterms, which allow us to construct canonical Boolean expressions directly from the table. These expressions can then be translated into logic diagrams, completing the conversion process from tabular to graphical representation.
Once we are comfortable with all basic forms of representing a function, and their inter-conversion, we shall look at transforming a given logic diagram into its equivalent NAND/NOR forms. Why do we need to do this and how is it done, would be discussed in the following section: